
Interaction to Next Paint (INP) will replace First Input Delay (FID).
The Core Web Vitals currently measure three key metrics on a website: loading speed with Largest Contentful Paint (LCP); interactivity with First Input Delay (FID), and visual stability with Cumulative Layout Shift (CLS). We now know that Interaction to Next Paint (INP) will replace FID, as it provides a more accurate measure of interactivity.
1- If there's already an interactivity metric, why change it?
The answer is simpler than it seems. According to Google, 90% of a user’s time on a website happens after the initial load.
While FID only measures the first interaction, INP considers all interactions throughout the website’s lifecycle. FID also doesn’t account for how long it takes to execute event handlers or the delay in displaying the next frame, making INP a much more accurate metric for interactivity.
Although some interactions take longer than others, it’s crucial to provide quick feedback to users, especially for more complex interactions.
In short, good interactivity means the website responds quickly to user actions.
The goal of INP is to minimize the time between a user’s interaction and the moment the next frame is painted on the screen.
2- What is INP?
Interaction to Next Paint (INP) measures the overall interactivity of a webpage by tracking the delay of all clicks, taps, and keyboard interactions during a user’s visit.
The final INP value is the highest observed latency, but it ignores extreme outliers.
- On websites with few interactions, the worst observed time (100th percentile) is used.
- On websites with many interactions, the 99th or 98th percentile is taken to provide a more accurate representation.
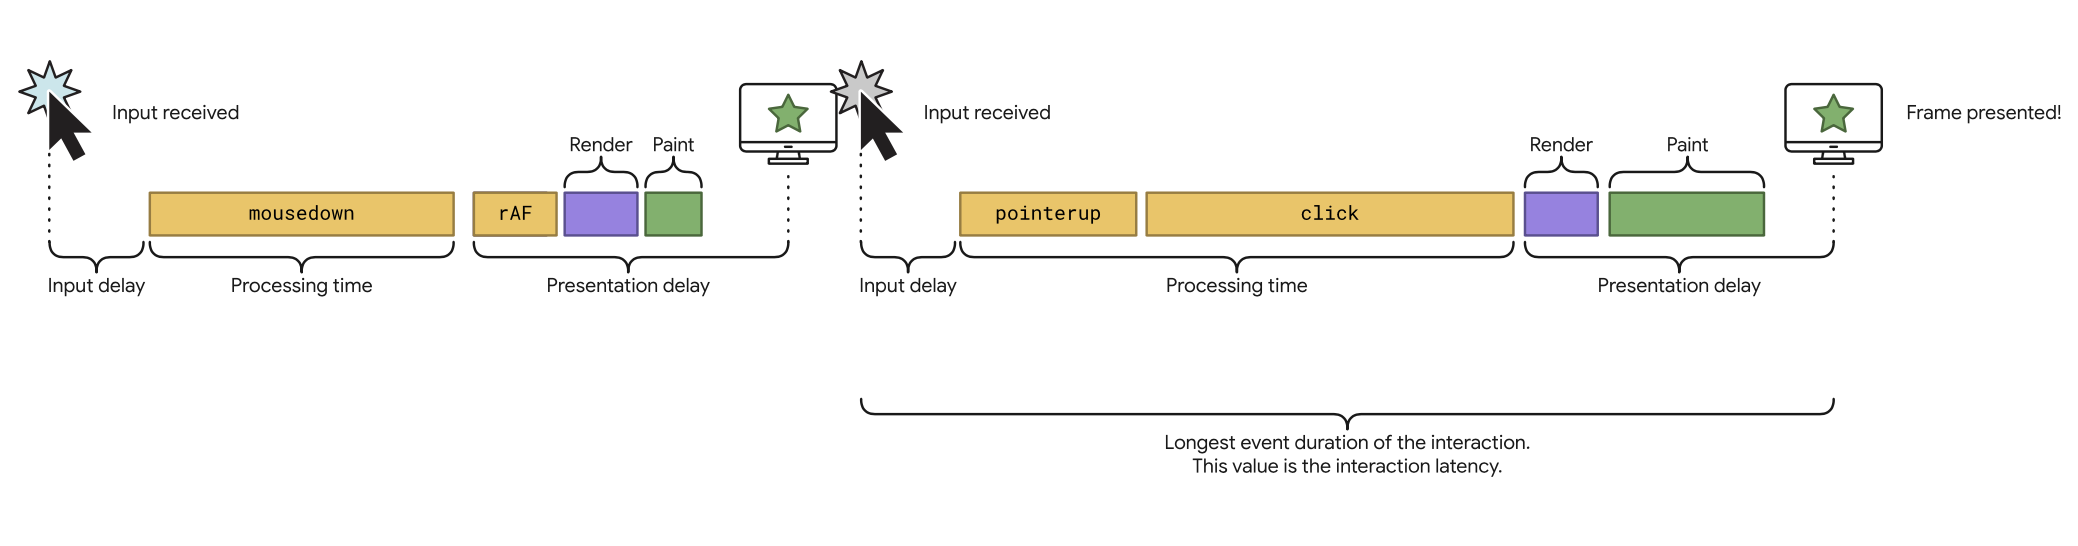
Note: An interaction is defined as the set of event handlers triggered by the same logical user action. The latency of an interaction is the duration of the longest-running event handler in the group, measured from the moment the user starts the interaction until the next frame with visual feedback is displayed.
3- How do I know if my website’s INP is good?
To determine if the INP is good, it’s recommended to look at the 75th percentile of real user data (field data), not lab data. Based on this data, we can define the following:
- Good INP: Below 200ms
- Needs Improvement: Between 200ms and 500ms
- Poor INP: Above 500ms
Now that we know what constitutes good and bad INP scores, the next question is likely: How are these values calculated?
To answer this, it’s important to understand what INP measures and what it doesn’t. As mentioned earlier, the interactions considered for calculating INP include:
- Clicking with a mouse
- Tapping on a touchscreen device
- Pressing a key, whether physical or on an on-screen keyboard
- Hovering or scrolling do not affect the calculation of INP.
Each interaction contains multiple events. For example, when pressing a key, we have the keydown, keypress, and keyup events. The longest duration event during the interaction is taken as the latency of that interaction.
Since INP is calculated when the user leaves the website, we can say that it provides a single value that represents the overall responsiveness of the site throughout its entire lifecycle.
It’s possible that the report doesn’t return an INP value. While there are several reasons for this, the main ones could be:
- The webpage loaded, but the user performed an action that isn’t included in the interactions measured by INP.
- The user never interacted with the page at all.
- The website is accessed by a bot.
4- How can I optimize my interactions?
Once we have field data, it’s essential to complement it with lab data to analyze in more detail and optimize slow interactions. To identify slow interactions in the lab, I recommend reviewing the following article.
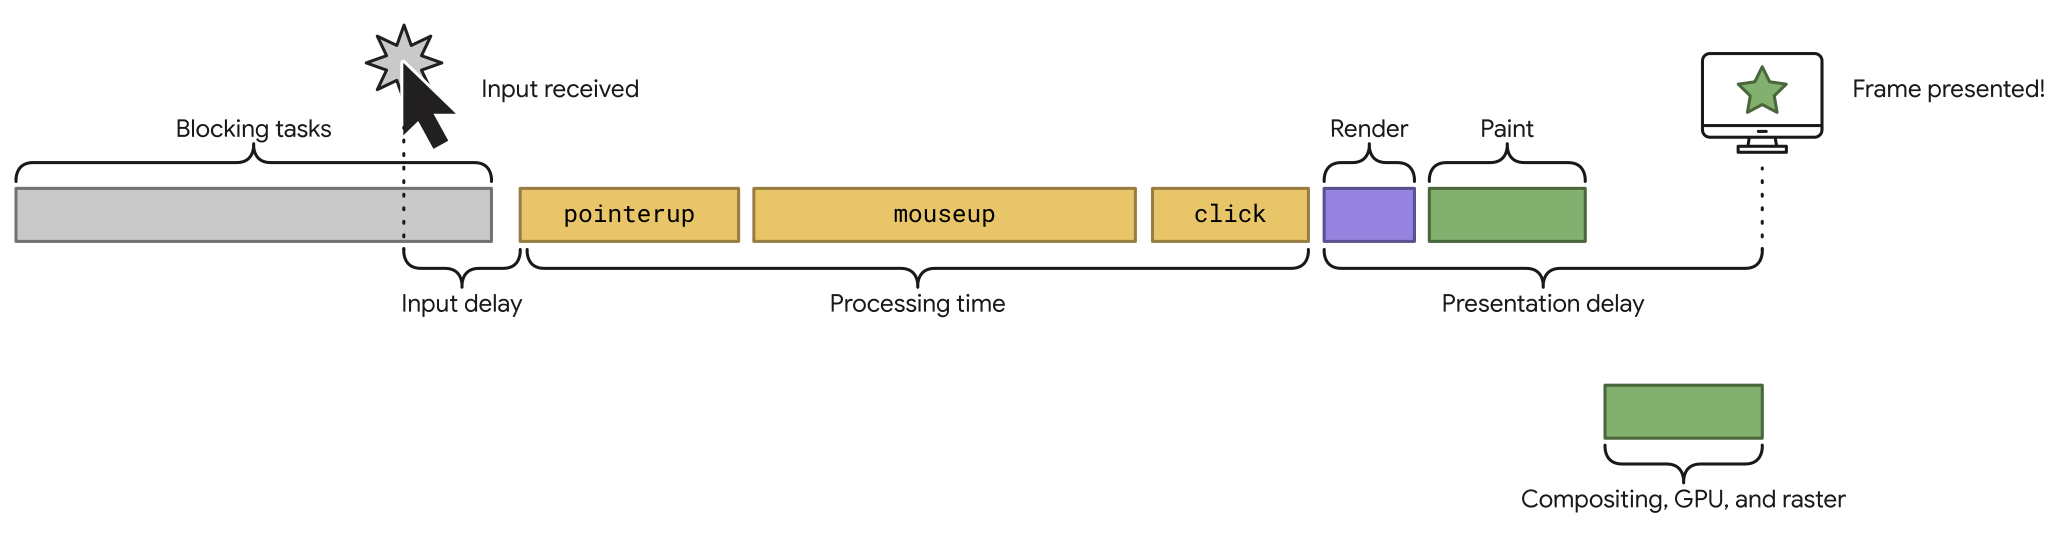
By identifying and reproducing interactions in the lab, we can start analyzing how to optimize them. You should keep in mind that interactions can be divided into three phases:
1. Input Delay: This phase begins when the user initiates an interaction and ends when the event callback for that interaction starts executing.
2. Processing time: This is the time it takes to complete the execution of the event callback.
3. Presentation delay: This is the time it takes for the browser to display the next frame that contains the visual result of the interaction.
The sum of these three phases is the total latency of an interaction.
To optimize the interaction, we must be able to identify and optimize each of these phases.
Input delay: This phase can be long if there is heavy activity on the main thread, timer functions, or overlapping successive interactions. A crucial aspect of interactivity happens during the site loading. Even if the webpage is rendered, it might not be fully loaded. If users try to interact with the page while it’s still loading, the input delay can increase. Evaluating scripts during the loading of your website can also prolong the input delay.
Processing time: To optimize this phase, you should try to minimize the work done by each event callback. If the task is too complex, you can split it into smaller tasks. Avoiding layout thrashing can also help optimize this phase.
Layout thrashing is a performance problem that occurs when styles are updated in JavaScript and then read in the same task. Some of the most common properties that cause this issue are:
elem.clientWidth, elem.scrollTo(), elem.focus(). For more information about this issue, you can read the
following text.
Presentation delay: Keeping the DOM size small is important because a large DOM can increase render times and slow down interactions. A good way to reduce rendering work is by using the CSS content-visibility property. This property allows us to lazily render elements as they approach the viewport, improving performance.
It’s important to consider the performance cost of rendering HTML using JavaScript. This process goes through the Critical Rendering Path, which includes the HTML parsing, style application, layout calculations, and layout rendering. These steps are inevitable and directly affect the interactivity of your website.